Open Rails Steam Parameters for Advanced Modellers
Aim - this section describes the "advanced" settings for steam related parameters in Open Rails (OR)
NB: These parameters are intended for advanced modellers who have an understanding of the information required, and have access to appropriate information.
If you wish to provide any feedback on this page, please use the contact page. It would br great to have some feedback as this helps to ensure the accuracy of the information and models.
Index
Open Rails Advanced Parameters for Steam Locomotives
Open Rails Implementation of Steam Cylinder Indicator Diagram
Superheat Cutoff Pressure Factor
Open Rails Advanced Parameters for Steam Locomotives
A summary of the key ADVANCED parameters that impact upon the performance of a steam locomotive are described in the following chart, and on this page.
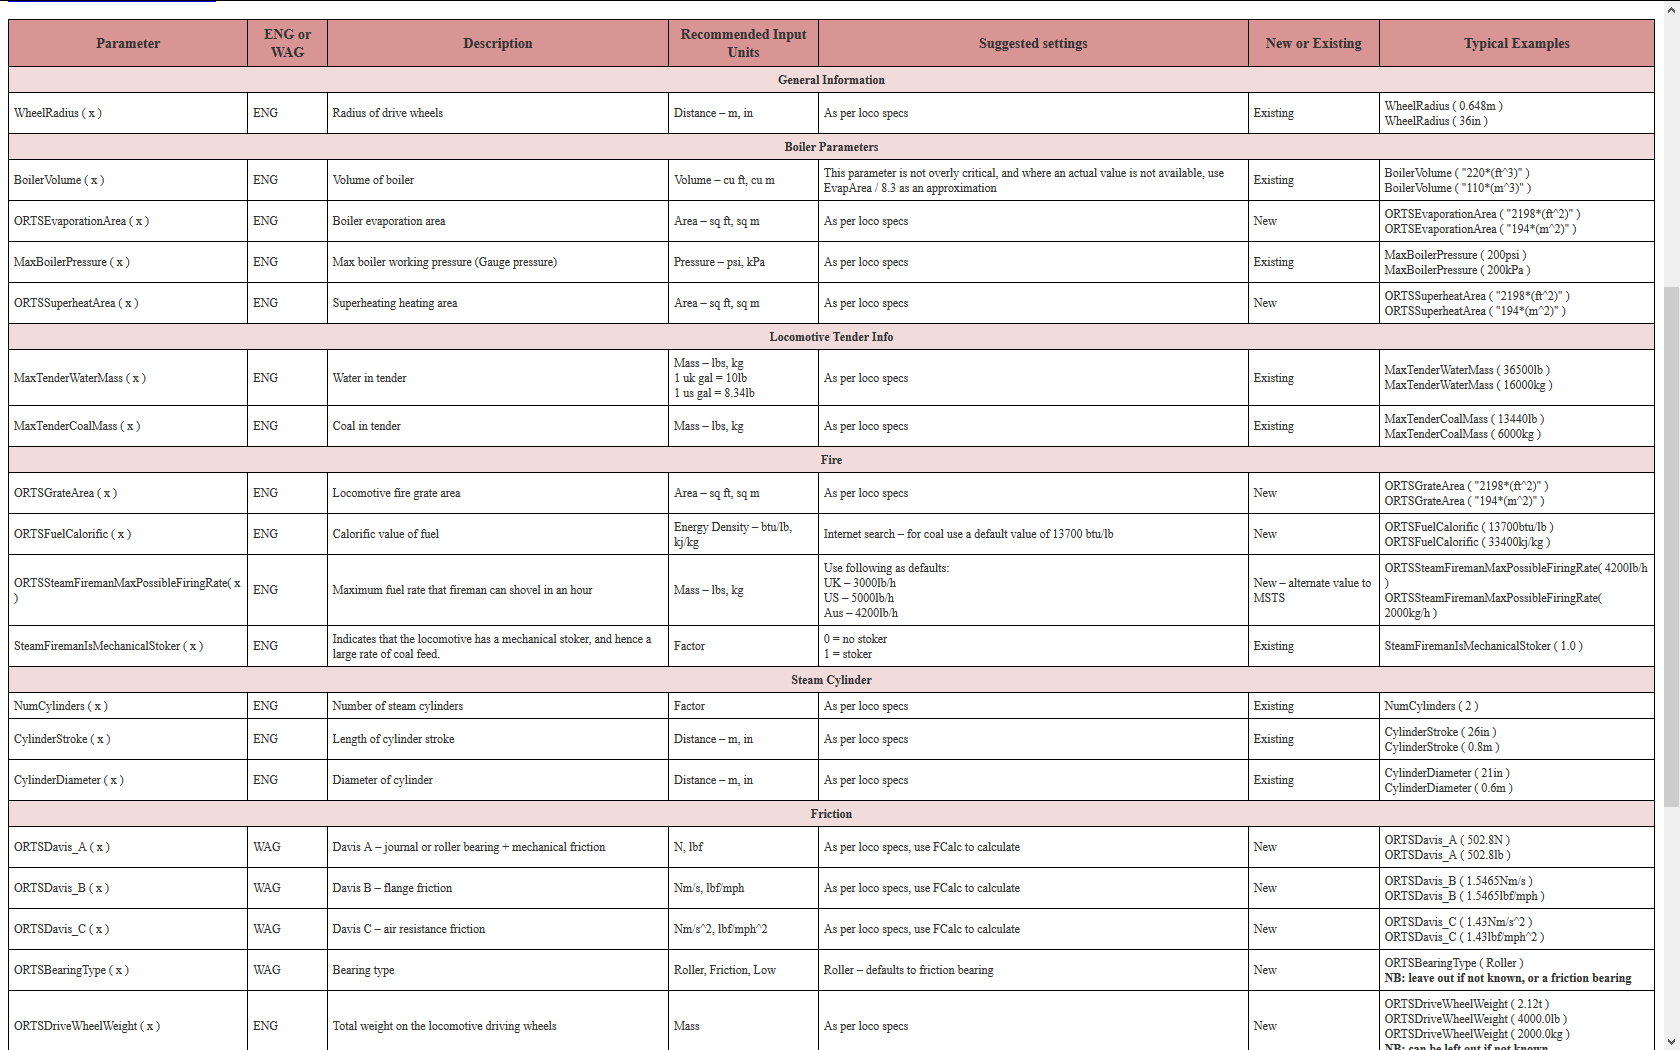 Advanced Parameters for
 When attempting to set the ADVANCED parameters it is recommended that the user has studied the OR Steam Model and uses the tools to monitor key performance measures.
Open Rails Implementation of Steam Cylinder Indicator Diagram
Open Rails uses a "typical" steam indicator diagram approach to calculate the M.E.P.. Once calculated the M.E.P. is used for calculation of the tractive effort, and IHP. The M.E.P. is also instrumental in calculating the steam used during each cylinder cycle, and as a result the total steam (and by association the amount of coal) used by the locomotive.
The base model reasonably closely approximates actual test figures recorded during tests of some representative locomotives by various railway companies. For example, the test results on page 4 of the summarised E2A Atlantic test report for the Atlantic locomotive show the pressure values at various points on the indicator cycle, at different speeds and reverser settings. Whilst the exhaust port settings for these tests are somewhat different from those used inthe Open Rails model, they are still within a reasonable degree of tolerance.
Some adjustment parameters have been added to Open Rails to allow experienced modellers to adjust settings to more closely align a locomotive's performance with known test results. it should be noted that these parameters are not required by default, and should only be added where specific known outcomes are sought. The various "advanced" settings are described below.
Boiler Evaporation
The amount of steam that a locomotive could produce on a consistent basis every hour is a critical value. The steam generation rate needs to be disigned to be greater then the usage rate of the locomotive, within practical bounds. If the steam generation rate is exceeded by the usage rate for long periods of time, then the boilker pressure would start dropping, until eventually the locomoive would be "powerless".
Typically the amount of steam that could be produced would be determined by a number of factors, including the type of fuel used in the locomotive, its grate area and draught through the firebox (determined the amount of coal that could be realistically burnt). The evaporation rate of a boiler could only be accurately determined by an appropriate steaming test. Evaporation rates were either measured in terms of the amount of steam actually produced, or when it was desired to compare performance of different locomotives "Equivalent Evaporation" was used as the measure. See the section below on Fuel Combustion for more detailed description.
From various tests, it was determined that the normal approximation for the amount of steam generated was in the order of 10-15 lbs per sq ft of grate area.
Open Rails Use
Open Rails uses a standard default set of values for all steam locomotives, and the defaults should suit most content modellers.
However, if a modeller wants to customise these values to specific values the following parameter statement should be added to the
Where:
x = Evaporation factor in lbs/sq ft of grate area.
Any value between 10 and 30 may be entered for this parameter. Typically most locomotive will have a value around 15, however some large locomotives, such as the New York Central 'Niagara' which could generate 125,000 lb/hr of steam from the boiler may have values up around 30.
As an example, the values would look like the following statement, if entered through the
Max Indicated Horsepower
Maximum Indicated Horsepower sets the theoretical maximum power produced by a steam locomotive. Typically the Indicated Horsepower allows comparison between different types of locomotives.
Open Rails Use
Open Rails attempts to calculate the maximum indicated horsepower of the locomotive from the design parameters entered in the
However, if a modeller wants to customise this value to a specific value the following parameter statement should be added to the
Any value may be entered for this parameter. The statement accepts any OR power unit of measure.
As an example, values would look like the following statement, if entered through the
Superheat Temperature
Superheated locomotives had better steam consumption, whilst producing higher amounts of work. The higher the superheat temperature, the more economical the steam consumption (and subsequent fuel usage).
Open Rails Use
Open Rails attempts to calculate the maximum superheat temperature of the locomotive based upon the size of the superheating element entered in the ENG file, and then uses this figure to limit the superheat temperature of the locomotive. The superheat temperature limits the amount of steam condensation in the steam cylinder, and hence reduces the steam consumption.
However, if a modeller wants to customise this value to a specific value the following parameter statement should be added to the
Most superheated locomotives operated at superheat temperatures up to approx 4000F. The statement accepts only temperature values in Fahrenheit.
As an example, the values would look like the following statement, if entered through the
Superheat Cutoff Pressure Factor
This parameter is only for Superheated steam locomotives, and will not impact the operation of Saturated steam locomotives.
Due to the extra heat in the steam of a Superheated locomotive, steam supplied to the steam cylin ders typically did not loose as much heat compared to saturated steam as it was supplied and injected into the steam cylinder. Consequently as the steam temperature was maintained close to the saturated steam temperature of the boiler, and thus there was minimal wire-drawing of the cutoff pressure with speed compared to the saturated locomotive.
Open Rails Use
This factor allows the cutoff pressure to be increased as appropriate, and allows a higher value of MEP to be calculated at speed. This reflects the capability of a superheated locomotive to produce a higher amount of "work" out of its steam cylinder.
Open Rails uses a standard default set of values for all superheated steam locomotives, and the defaults should suit most content modellers.
However, if a modeller wants to customise the MEP value, then the following parameter statement should be added to the
Where:
x = factor.
Any value between approximately 10 and 75 may be entered for this parameter.
As an example, the values would look like the following statement, if entered through the
Cylinder Port Opening Size
This parameter is only for Saturated steam locomotives, and will not impact the operation of Superheated steam locomotives.
As the speed of the engine increases, the cutoff pressure point decreases as the port opening on the cylinder is not sufficient for the increased steam to operate the increasing speed of the piston efficiently. To understand this better, the speed of the piston increases from zero at the dead point (start of stroke) to the middle of the stroke, while in the ordinary working cutoff notches, the port opening begins to reduce soon after passing the dead center, and closes when the piston is at its greatest speed. In general, the shorter the steam port, the greater will be the drop in cutoff pressure.
By studying the valve motions it appears that the length of steam port, in inches, varies from 0.05 to 0.12 of the area of the cylinder in square inches. In the case of the Allen or Wilson valves, which give a double opening, the effective port length is really twice the actual length, and it should be so considered when analyzing the cutoff pressure point on the steam line.
The ratio of cut-off pressure to initial cylinder pressure varies for various speeds of rotation and percentages of cut-off. As a general rule, lower cutoff pressures will occur at a given speed for early, or small cut-off values. By way of explanation, when the valve closes the port early in the stroke, the steam is much more wiredrawn, partly because the port is not fully opened at any time, and partly because the closing of the port begins almost as soon as the stroke has commenced and, in fact, closes very shortly after it has opened.
Open Rails Use
Open Rails uses a standard default set of values for all steam locomotives, and the defaults should suit most content modellers.
However, if a modeller wants to customise the size of the port opening to a different specific value, then the following parameter statement should be added to the
Where:
x = Factor representing the size of the port opening on the cylinder.
Any value between 0.05 and 0.12 may be entered for this parameter.
As an example, the values would look like the following statement, if entered through the
Boiler Efficiency
Boiler Efficiency is a measure of the efficiency of the boiler. It represents the ratio of the heat absorbed by the steam generated, to the heat contained in the coal as it was fired. Typically, it is depicted in graphical form as shown below, where x-axis is Dry coal fired per Square Foot of Grate per hour, and the y-axis is efficiency.
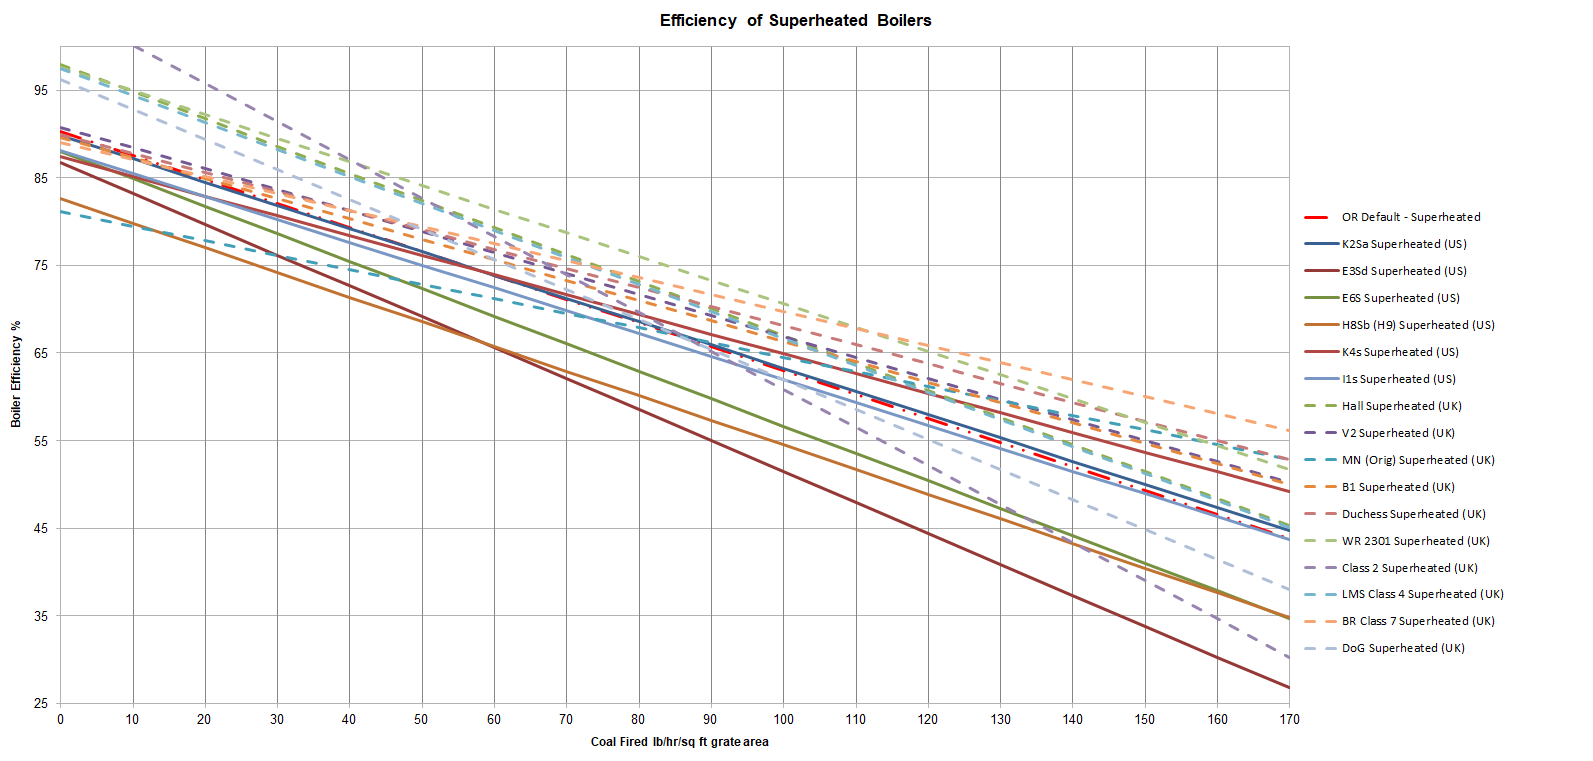
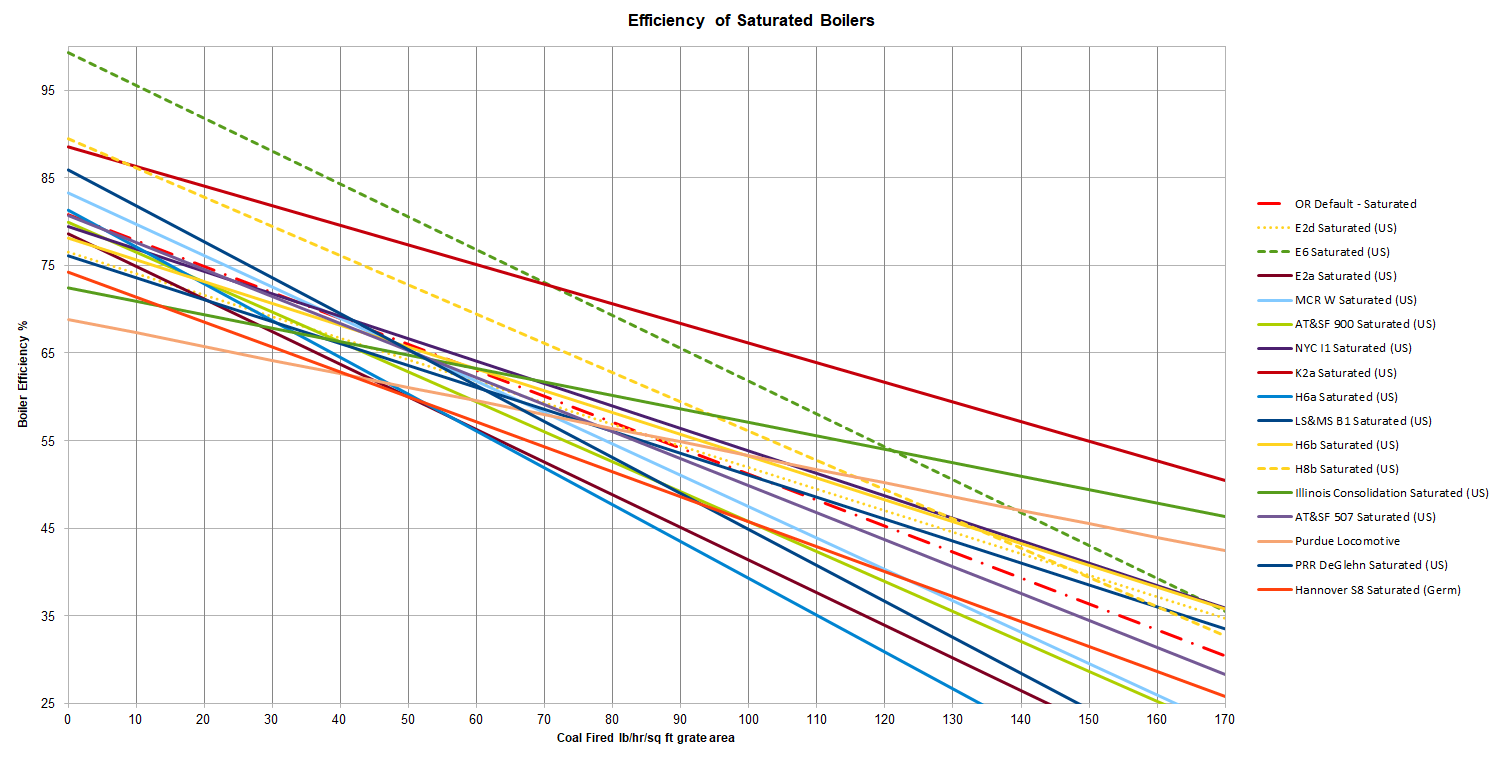
On the above diagrams a number of boiler efficiency lines for different locomotive types have been plotted for the sake of comparison. The curves shown represent the actual curves of some of the test locomotives available from the test rolling stock page. The default curves used by Open Rails (one for Saturated locomotives and one for Superheated locomotives) are shown in red.
An example graph plot of Boiler Efficiency vs Dry Coal Fired per Square Foot of Grate per Hour can be found in this publication, see Fig 32 on pg 47. A more modern version can be found in this BR Test Report for a B1 Locomotive. This diagram also shows the Grate Limit for the Boiler.
Grate Limit - can be defined as "the point at which even by firing more coal and supplying more combustion air, no more steam could be produced."
L. H. Fry derived an equation in 1924 which relates the grate limit to the boiler efficiency as follows, however, note the formula was found not to apply to Gas Producer Combustion System (GPCS) Fireboxes:
where,
Eb = Boiler Efficiency
M = Firing Rate
G = Grate Area
k1 = predicted boiler efficiency at zero firing rate
k2 = the slope of the graph relating boiler efficiency to firing rate.
Although Boiler Efficiency is empirically derived, it has an interesting property, which can be proved mathematically, namely, the efficiency at the grate limit is exactly half that of the efficiency at zero firing rate. The plot of Boiler Efficiency vs Dry Coal Fired per Square Foot of Grate per Hour is also a straight-line curve. This is not always shown in the reports as it is difficult to measure at low firing rates. Some reports even show the plot as an actual curve. For more information please refer to the 5AT Project site.
Open Rails Use
Open Rails uses a standard default set of values for all steam locomotives, and the defaults should suit most content modellers.
However, if a modeller wants to customise these values to specific values the following parameter statement should be added to the
Where:
x = Dry Coal Fired per Square Foot of Grate per Hour in lbs/sq ft/hr
y = Boiler efficiency (input as a fraction based upon % efficiency, ie 75% = 0.75)
Any number of value pairs can be used, as long as there are two or more pairs, and the info is always in pairs.
As an example, the values would look like the following statement, if entered through the
The Grate Limit for the Default Superheated Locomotive has been taken as 180 lbs/sq ft/hr. The Grate Limit determines the upper coal consumption point, and hence can be used to define the gradient of the Boiler Efficiency Curve.
For simplicity, the following statement can be used with just two pairs of numbers, the zero-rate efficiency and the grate limit efficiency which is exactly half.
This will give exactly the same output as the lengthier statement above, since the curve is known to be a straight line.
Wherever possible it recommended to use inputs from known reports, otherwise the default efficiencies will normally suffice. Obviously locomotives with a similar boiler design to a known report may be used with care.
Fuel Combustion
The amount of fuel used by a locomotive is an important element as it determines the economic efficiency of the locomotive. Therefore an important design consideration of a locomotive is the amount of coal used by the locomotive to generate its designed steam output. Typically the following type of graph plot would be developed to demonstrate this locomotive performance parameter.
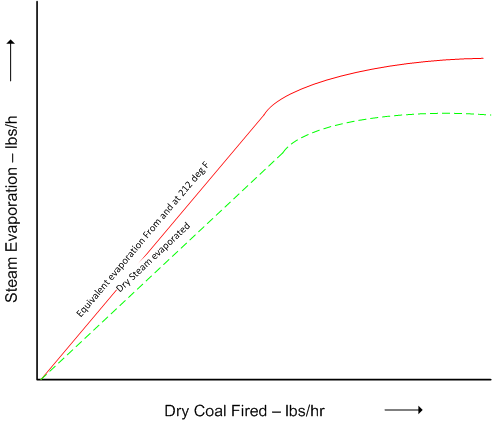
The green curve shows the actual evaporation of the boiler at different fuel levels. Often for the sake of comparison in test reports, only the red (or Equivalent evaporation From and at 212 deg F) curve was shown on the graph plot, and it may be necessary to do calculations to convert it. See the following section for more information.
An example graph plot of Equivalent Evaporation vs Dry Coal Fired can be found in this publication, see Fig 6 on pg 19.
Interpreting Steam Locomotive Boiler Test Reports
When a steam boiler heats up water, bubbles breaking through the water surface will pull tiny water droplets in with the steam. Unless a superheater is used, this will cause the steam supply to become partially wet (wet steam) from the added liquid.
Steam dryness is important because it has a direct effect on the total amount of transferable energy contained within the steam (usually just latent heat), which affects heating efficiency and quality.
For example, saturated steam (100% dry) contains 100% of the latent heat available at that pressure. Saturated water, which has no latent heat and therefore 0% dryness, will only contain sensible heat. Naturally superheated steam had more heat in it, and therefore wet steam was not as likely to be present in superheated locomotives. When wet steam was injected into the cylinders some of the steam would tend to condense due to coming into contact with the cooler walls of the cylinders.
To calculate the amount of "dry steam" used by the locomotive a correction factor was used to convert from "wet steam".
Steam locomotive boiler test reports were empirically generated, ie the locomotive was run under certain circumstances and key pieces of information were measured. Using these measured values other information was calculated. For example, the amount of steam generated was determined by measuring the amount of water delivered into the boiler. It was then assumed that all of this water was converted to steam. Thus a value for the amount of "wet steam" was able to be measured.
Dry Steam (lbs/hr) = Correction Factor x Wet Steam (lbs/hr)
Typically this correction factor might be around 0.99, thus a value of 1.0 could be used without significant loss of accuracy.
To enable easier comparisons of different locomotives, the graphs or tables often plotted "Equivalent evaporation From and at 2120F" against the amount of dry coal fired per hour. Equivalent evaporation From and at 2120F indicated the amount of water, usually in pounds per hour, evaporated from a temperature of 2120F (1000C) to saturated steam at the same temperature.
However the actual amount of steam evaporated would be dependent upon the actual boiler input temperatures occurring during the operation of the locomotive. Thus to convert the equivalent evaporation, a scaling factor called the Factor of Evaporation was used. The Factor of Evaporation is the rastio of heat required to generate one pound of steam for the given conditions (ie the locomotive operating boiler pressure, temperature and feed-water temperature) to the amount of heat required to generate one pound of dry steam from and at 2120F.
Thus
Equivalent evaporation (from and at 2120F) = Factor of Evaporation x Actual evaporation
In most instances it would appear that the Factor of Evaporation is mostly between 1.0 and 1.2, but can vary outside of this range.
If desired more information on calculating the Factor of Evaporation can be found in the document Principles of locomotive operation and train control on pg 161.
Open Rails Use
Open Rails uses a standard default set of values for all steam locomotives. For convenience they are based upon the steam consumption in the steam cylinders, which aligns with the actual evaporation curve. On the graph below, a number of curves have been plotted based upon information taken from available locomotive performance test reports. Based upon these curves, an "average" value has been set within OR for all locomotives. These defaults should suit most modellers using hand fired locomotives up to about 35,000 lb/hr evaporation rates, however in some instances it may be necessary to vary the curve as described below in the
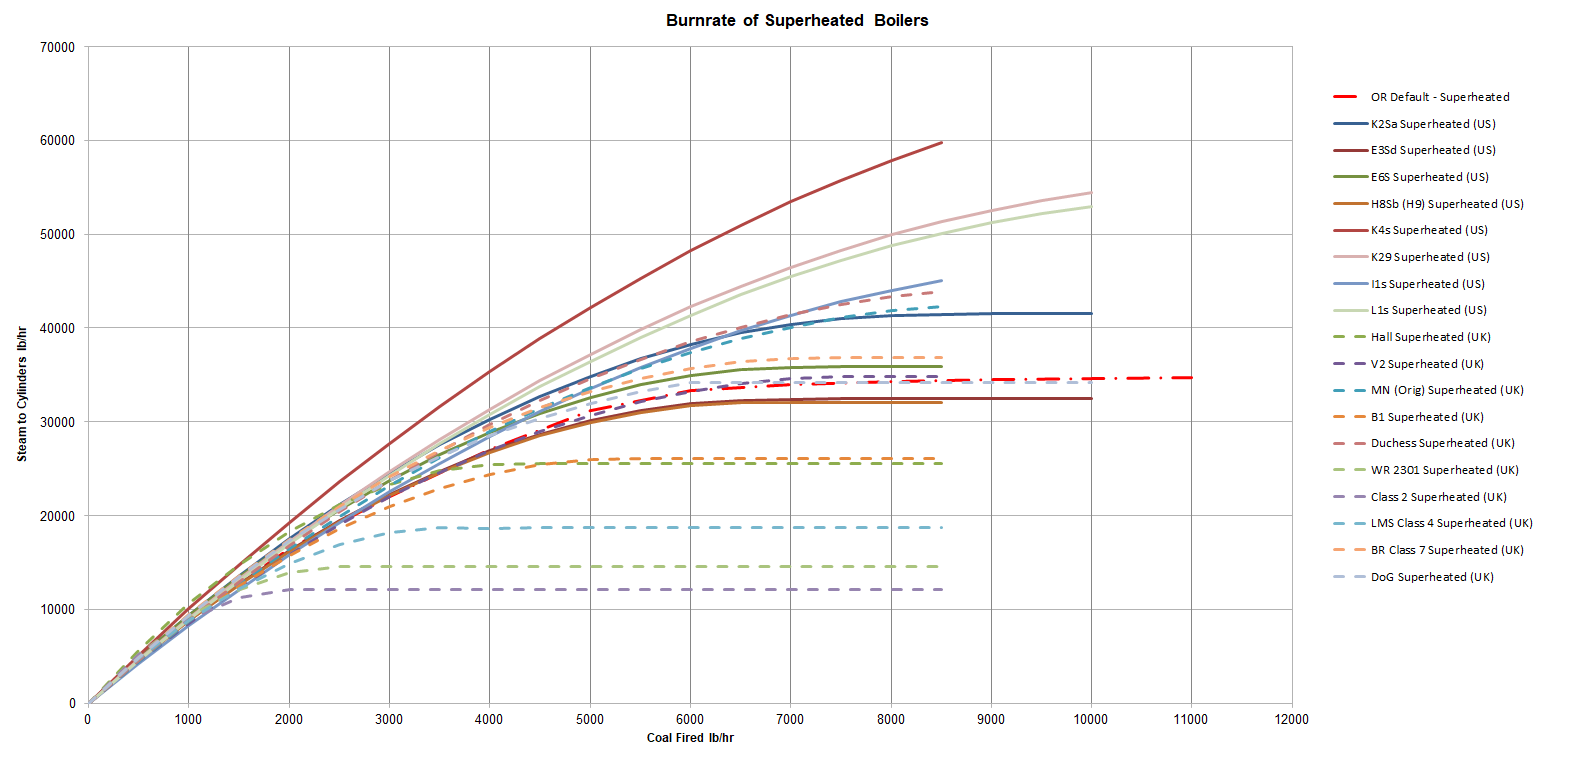
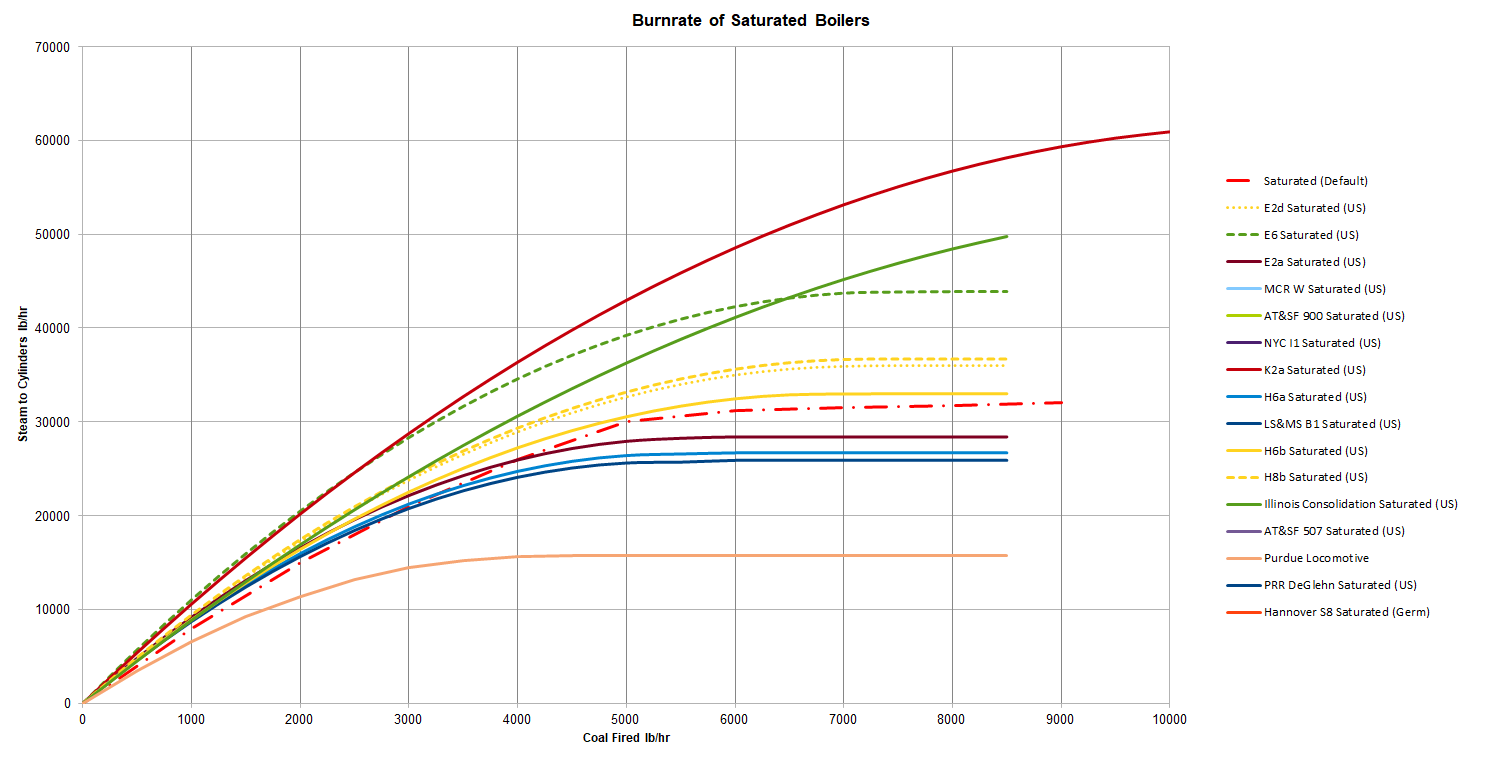
The default curves used by Open Rails (one for Saturated locomotives and one for Superheated locomotives) are shown in red.
However, if a modeller wants to customise these values to specific values the following parameter statement should be added to the
Where:
x = Actual steam evaporation rate in lb/hr
y = Dry coal fired rate in lbs/hr
Any number of value pairs can be used, as long as there are more than two pairs, and the info is always in pairs.
As an example, the values would look like the following statement, if entered through the
Related Points
- Burnrate curves should be relevant to the coal calorific value configured.
- Continued operation at full steam usage levels may excced the capacity of the fireman to cope with the demands of shovelling coal into the fire. Typicaly a human fireman was expected to doing a number of activities besides actually shovelling coal into the fire; in addition the purely physical effort of lifting coal from the tender into the fire also was a factor in how much coal could be fired per hour. It appears that rates varied between countries which was probably related to the size of shovel used, firebox and grate sizes, as well as environmental conditions. As a rule of thumb, the following values were considered to be the average firing values, UK: 5 scoops/min or 3000 lbs/hr (10lb shovels), Aus: 7 scoops/min or 4200lb/hr (10lb shovels), US: 6 scoops/min or 5000lbs/hr (14lb shovels). The parameter for SteamFiremanMaxPossibleFiringRate ( x ) should be set accordingly.
Initial Pressure Drop
As described and shown in the indicator diagram, the steam will decrease in pressure as it is feed through the piping from the boiler, into the cylinder steam chest, and eventually into the cylinder itself. The pressure of the steam upon entery into the cylinder is called the "Initial Pressure". This loss of pressure can be attributed to frictional losses in the throttle valve, pipework between throttle and steam chest, leaks in steam chest, and losses due to the port openings into the cylinder. From empirical measurements it has been seen that the pressure drop increases as the speed of the locomotive increases.
Open Rails Use
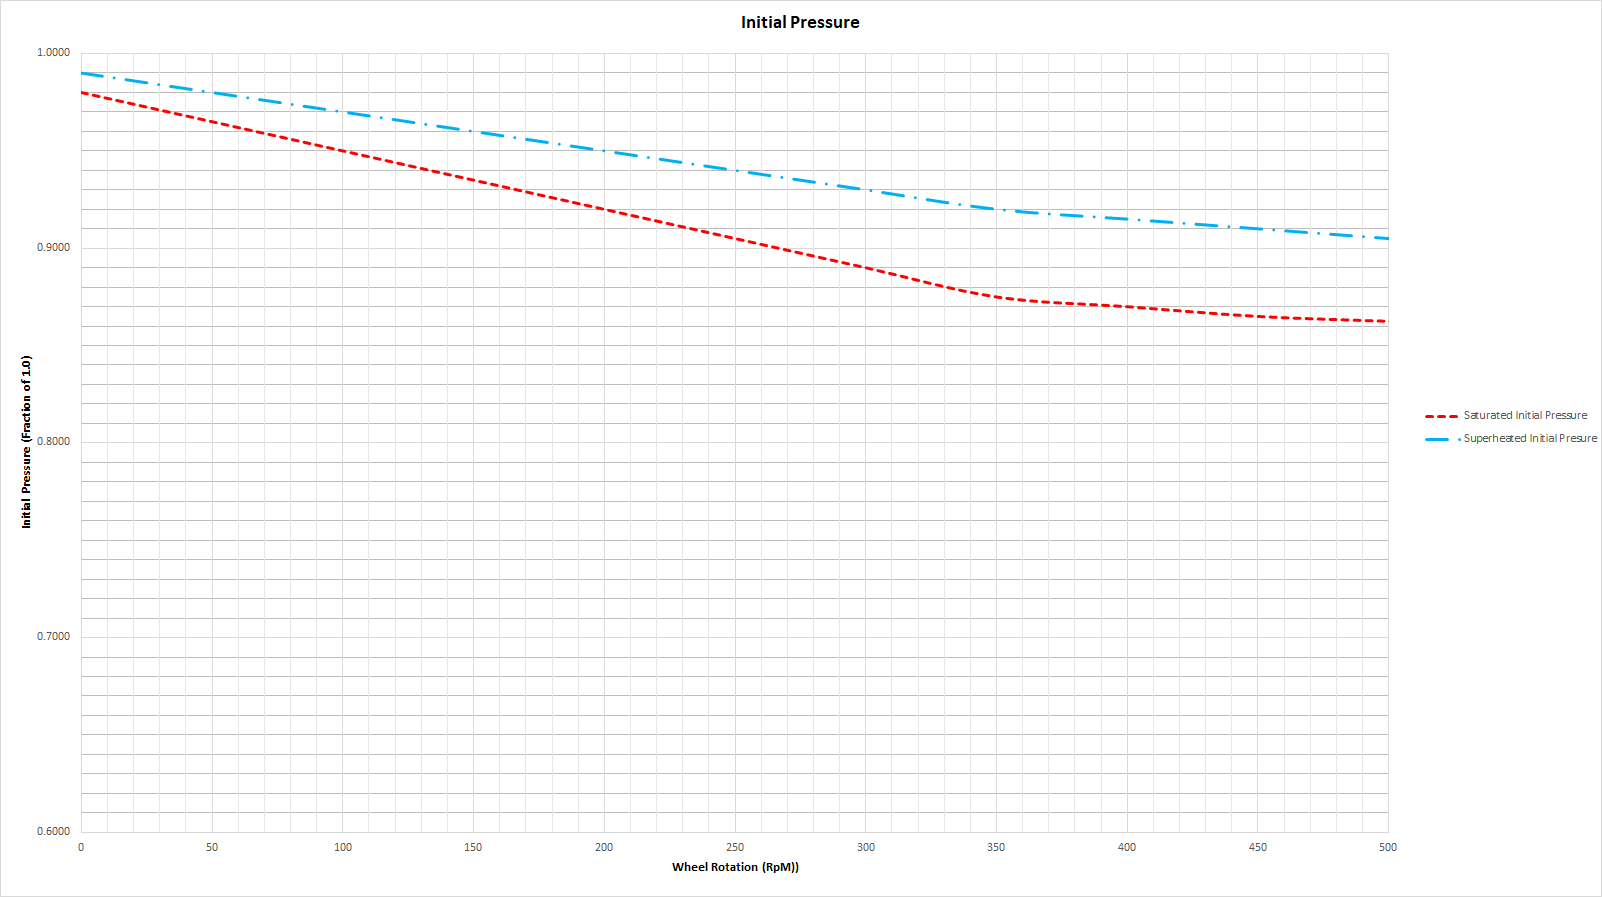
The pressure drop between the working boiler pressure and the initial pressure is modelled within Open Rails by default as shown on the diagram above for superheated and saturated locomotives, but can be adjusted if desired by inserting the following statement into the
Where:
x = Wheel revolutions per minute in rpm
y = Initial to boiler pressure drop factor
Any number of value pairs can be used, as long as there are a minimum of two pairs, and the info is always in pairs.
As an example, the values would look like the following statement, if entered through the
Cylinder Back Pressure
As described and shown in the indicator diagram, as steam is exhausted from the cylinder, a certain amount remains, due to the construction of the cylinder passages and exhaust pipes, the speed of the engine, the elements of the valve gear and pressure of operation. The back pressure effectively reduces the amount of work done by the cylinder. The size of exhaust nozzle and the clearance of the valve probably control the back pressure more than any other factors. Locomotive designers ideally seek to reduce the back pressure in order to improve the work efficiency of the cylinder, but it needs to be understood that changing the back pressure will also effect the drafting capabilities of the locomotive.
Back pressure will naturally increase as the locomotive increases in speed and needs to exhaust more steam through the exhaust nozzle.
The change in back pressure as the locomotive speed increases is modelled within Open Rails by default, but can be changed if desired.
Open Rails Use
Open Rails uses a standard default set of values for all steam locomotives, and the defaults should suit most content modellers.
However, if a modeller wants to customise these values to specific values the following parameter statement can be added to the
Where:
x = Indicated Horsepower in hp
y = Back pressure in psi (atmospheric)
Any number of value pairs can be used, as long as there are minimum of two pairs, and the info is always in pairs.
As an example, the would look like the following statement, if entered through the
Duplex Steam Engines
Some steam locomotives, such as the PRR T1, had more then one steam engine (ie, a set of cylinders and separate drive wheels). This can be modelled in OR by defining multiple steam engines in the following format.
ORTSSteamEngines ( x
Steam (
Various steam engine parameters as described below.
)
)
where
x = steam engine number
To see relevant associated controls, refer to the Visual Effects, Sounds and Cab Controls pages and parameters.
To add a booster steam engine see the following section.
Booster Steam Engines
To model a steam booster engine insert the additional following parameters into the above Duplex steam format.
To see relevant associated controls, refer to the Visual Effects, Sounds and Cab Controls pages and parameters.
Hammer Blow Force
Hammer blow force can create large distorting forces on railway tracks and rail infrastructure such as bridges. These forces can eventually damage this infrastructure. As indicated hammer force is proportional to the square of the locomotive speed, so as steam locomotives were designed to operate at faster and faster speeds, it became more important to manage the balancing forces of the reciprocating rods.
OR will assume a default value for this parameter, but if it is known then the excess (or over) balance can be entered into the